Operations & Maintenance
The type of maintenance performed on an asset and the associated investment from the maintenance budget can be guided by the asset’s risk.

Routine or Planned Maintenance – regularly scheduled maintenance, completed on a calendar or use base schedule. Routine maintenance dollars spending is fairly evenly spread across the asset inventory with a slight weighting toward the high-risk assets. An example of how the budget can be divided amongst the four quadrants is discussed below. Data on the assets can lead to adjustments in the share of assets per quadrant to ensure funds for routine maintenance are spent efficiently.
This chart shows an option for how to dedicate budget percentages to assets receiving routine or planned maintenance. In this example, low-risk assets receive about 20% of the budget. Moderate-risk assets that have lower probability, but higher consequence, 25% of the budget. Moderate-risk assets that have higher probability, but lower consequence, 25% of the budget. High-risk assets, 30% of the budget. It is important for your utility to evaluate how many and which assets are in each part of the chart.
There are some assets that will receive little to no routine maintenance. These assets include: assets for which routine maintenance is not possible or necessary to keep the asset in working order, assets being run to failure, assets already scheduled for replacement soon, assets replaced based on a pre-determined schedule or volume for which routine maintenance is not necessary to enable the asset to last that long. Examples of assets that might receive little to no maintenance includes small diameter water lines, water meters, utility access hole covers, or sump pumps that are constantly underwater.
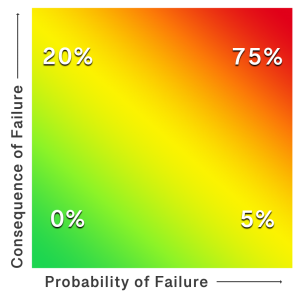
Predictive Maintenance – condition monitoring used to predict when asset failure will occur.
Predictive maintenance is costly and cannot be completed for every type of asset. Therefore, it should be used selectively. An example of how the budget can be divided amongst the four quadrants is discussed below. Data on the assets can lead to adjustments in the share of assets per quadrant to ensure that funds for routine maintenance are spent efficiently.
This chart shows an option for how to dedicate budget percentages to assets receiving predictive maintenance. In this example, low-risk assets may be ideal for a run-to-failure approach and not have any predictive maintenance completed. Moderate-risk assets that have lower probability, but higher consequence, 20% of the budget. Moderate-risk assets that have higher probability, but lower consequence, 5% of the budget. High-risk assets, 75% of the budget. It is important for your utility to evaluate how many and which assets are in each part of the chart.
It is not cost-effective to perform this type of maintenance on assets that are of low consequence. In these cases, the benefit of the information (knowing a better time to replace the asset before failure) is not worth the cost, because asset failures do not need to be prevented.
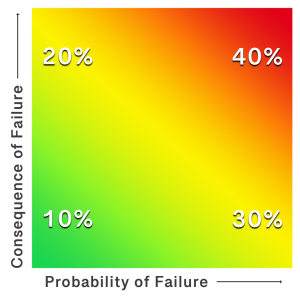
Preventive Maintenance – conducted to maintain operating condition and slow deterioration.
Since preventive maintenance is conducted to prevent failure, it should focus on those assets with a higher probability of failure. An example of how the budget can be divided amongst the four quadrants is discussed below. Data on the assets can lead to adjustments in the share of assets per quadrant to ensure that funds for routine maintenance are spent efficiently.
This chart shows an option for how to dedicate budget percentages to assets receiving preventative maintenance. In this example, low-risk assets could receive about 10% of the budget. Moderate-risk assets that have lower probability, but higher consequence, 20% of the budget. Moderate-risk assets that have higher probability, but lower consequence, 30% of the budget. High-risk assets, 40% of the budget. The preventive maintenance can keep an asset that is showing signs of failure from moving into functional failure or from functional failure to catastrophic failure. It is important for your utility to evaluate how many and which assets are in each part of the chart.