Condition
It is important to identify the existing condition of the assets in the inventory and update it regularly. The asset condition defines the physical state of the asset at this moment in time and helps inform useful life remaining, maintenance interventions, replacements, and other asset decisions. The condition assessment should help the system:
- Identify assets that are underperforming
- Predict when assets will fail to deliver the desired level of service
- Determine reasons for asset performance deficiency
- Determine the type and timing of maintenance interventions or corrective actions
- Use in data-informed decision-making
A condition assessment can be completed in many different ways, depending on the capability and resources of the system. The simplest approach is to gather people who have current or historical knowledge of the assets in a room. The group can then select a condition rating approach (0 through 5, A through F, Excellent through Unacceptable, etc.). The group then considers what would constitute an asset in each of the categories. For example, if a 1 through 5 rating system is being used, the group should decide what a “1” asset would entail, what a “5” asset would entail and then develop 2, 3, and 4 to be between these boundary conditions.
A pilot project can be performed using a small subset of assets to test the effectiveness of the chosen ranking system. Each asset in the pilot project is ranked based on condition, and then everyone can examine the results to determine whether they make intuitive sense and if the selected approach was easy to use. If needed, the condition rating system can be revised, and the pilot repeated. Once the condition rating system is selected it should be used consistently throughout the system. This approach relies on the best information available but does not require systems to gather additional data in order to rate the assets. Any condition rating system that is understood by the system and is consistently applied is acceptable.
Table 2: Condition Rating System Using Numbering
Condition Rating
Condition
Description
Table 3: Condition Rating System Using Letters
Condition Rating
Condition
Description
Table 4: Condition Rating System Using Remaining Life
Condition Rating
Condition
Description
Table 5: Unified Condition Scale
Condition Rating
Condition
Description
Source: Stormwater Strategic Asset Management Plan, Johnson County Stormwater Manamgement Program | January 2019
Table 6: Visual Inspection Condition Rankings
Condition Rating
Criteria
Description
Source: County of Hawaii Department of Environmental Management, Wastewater Division
Information needed to develop condition rankings may be found in sources such as, source water protection assessments and plans, watershed management plans, habitat restoration plans, master plans and local critical areas assessments and plans.
At a higher level or as a next step after the initial ratings of the assets, systems can gather data on asset condition through more sophisticated means and re-rate the assets. However, it is generally unnecessary to develop very detailed condition rating systems.
Asset condition will change over time as assets age and as they are used during normal operations. Therefore, the asset condition must be continuously updated to keep the data current. Some assets will decay over time while others may grow and improve over time.
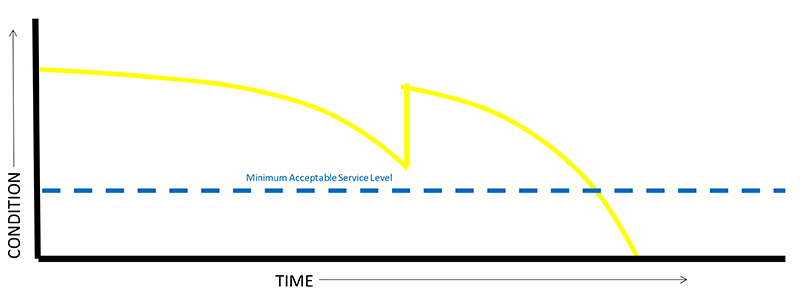
Condition Curve – Typical Gray Asset

The condition curve above is typical for a gray asset, where the condition is the best when the asset is first installed, it deteriorates over time (sometimes the curve is flat for a while and drops quickly, sometimes it curves down very slowly depending on the asset and how it is maintained), once the asset approaches the dashed line, the minimum accepted service level, the asset must be repaired, rehabilitated or replaced. If it is repaired or rehabilitated, the condition immediately returns to nearly new as shown by the vertical portion of the curve. Then it will go through the process again. Eventually the system will decide to replace the asset and allow it to run to failure as shown here or replace it before it fails.
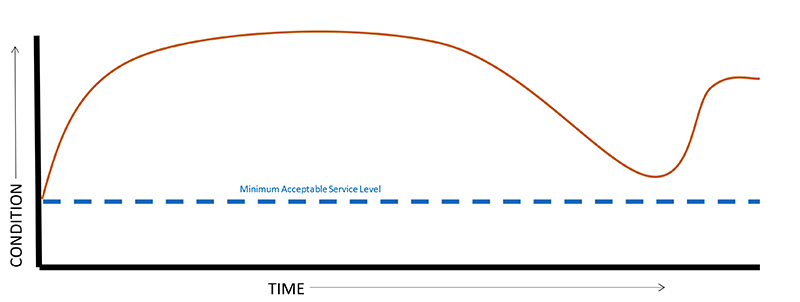
Condition Curve – Typical Green Asset

This second condition curve is more typical for a green asset, where the condition is likely lower when the asset is first installed. Over time, vegetation grows and the performance improves. After a few months or years, the asset condition becomes stable and the line nearly flattens. This high level of condition should last for a few years to a few decades depending on the type of asset. Eventually the asset condition will begin to decay, possibly due to soil contamination or plant life ending. This may happen quickly, or it may happen over a period of years. Once the asset approaches the dashed line, the minimum accepted service level, the asset must be repaired, rehabilitated or replaced. If it is repaired or rehabilitated, the condition will begin to improve until the plants reach maturity where the condition will stabilize, and the line will flatten again. Then it will go through the process again.
Asset condition should be updated regularly. The time interval between updates may vary from system to system, but generally annually is a good time to revisit the condition assessment. Also, as assets receive routine, preventive, or corrective maintenance, condition can be assessed, and the resulting condition rating can be revised in the inventory.
When defining asset condition, the system must consider the factors that may cause the asset to change over time. For mechanical assets that might include run time and maintenance history, while for passive assets that might include length of time in use, installation conditions, and maintenance history. The asset condition ranking should take into consideration the purpose of the asset, how it helps maintain Level of Service, and its design function and then determine how it is performing compared to how it was intended to perform.
Examples – Factors Affecting Asset Condition
Pump
Volume throughput, maintenance history, used as designed, age
Infiltration planter
Vegetation cover and health, tree health, soil (erosion, compaction), structure condition, sediment
Stream
Water quality parameters, biological condition, recreational values
WRF’s PROJECT NO. 4727 – Asset Management Framework for Forested and Natural Assets, Table 6‐5. Examples of Data Sources That Utilities Can Use for Natural Asset Inventory and Condition Assessment lists several data sources that can be used to help develop an inventory or condition ratings along with notes and considerations about those sources. While the list is specifically for natural assets, in some cases the sources are appropriate for other types of assets. The sources include National Land Cover Database, USDA National Forest Data Sets, USFS Forests to Faucets, GAP/LANDFIRE National Terrestrial Ecosystems, National Wetlands Inventory (NWI), State and Local Wetlands Inventories, Federal Emergency Management Agency hosts a National Flood Hazard Layer (NFHL), US Army Corps of Engineers National Levee Database, Local River Mapping Projects, NWI Wetland Mapper (riparian zones), GAP/LANDFIRE National Terrestrial Ecosystems, USGS National Hydrography Data Sets, USGS Groundwater Data, USGS Data on Glaciers in the US, Natural Resources Conservation Service USDA Snow Telemetry Data; NRCS State Snowpack Data (e.g., Colorado); EPA Climate Indicators (Snowpack), EPA’s Enviro Atlas State Natural Heritage Network (NatureServe) Ecoatlas (multiple natural assets, California focus).