Criticality Examples
Consider the following scenario:
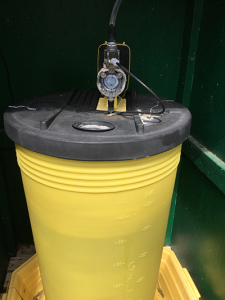
Asset: Chlorine pump. System uses hypochlorite so liquid chlorine solution is pumped into the system for disinfection. The system has both spare parts and a spare pump.
Service History: Chlorine residuals are checked three times a week in the system. Unless the residual is very low, the chlorine pump is not checked at the same time. It is checked only once every 2 weeks to ensure it is running but otherwise it is ignored. It receives no maintenance and is in poor condition. The chlorine pump has failed due to many factors 7 times in the past 10 years. When the pump fails, there is no chlorine going into the system. This fact may not be determined until the residual is checked or if it happens to be the day the pump is inspected. Once the lack of chlorine is observed, the well must be shut off until a new pump is installed. Having the well off for the short time it takes to replace the chlorine pump is not problematic since the customers can be served from the storage tank. The pump is showing signs of potential failure.
Probability of Failure Ranking (PoF): 4
Using a PoF scale of 1-5, this chlorine pump receives a PoF score of four (4) because the pump is in poor condition, is not maintained, has failed many times, and is showing signs of failure.
Ranking
Description
Consequence of Failure: 4
Using a CoF scale of 1-5, this asset receives a CoF score of 4 because a failure in a chlorine pump has the potential to be a major consequence. Customers may be drinking water that is not disinfected for two to three days before discovery. The consequence is mitigated by the presence of a spare pump and spare parts. However, because the pump may fail for multiple days before the failure is known, the consequence is not substantially reduced by the spare parts and pump.
Ranking
Description
Multiply the Probability of Failure with the Consequence of Failure to find the Criticality Score.
Probability of Failure Ranking: 4
Consequence of Failure: 4
To calculate the pump’s criticality score, multiply the PoFProbability of Failure score by the CoFConsequence of Failure score. In this example, the pump’s criticality score is 4 x 4 = 16. A table can be helpful to visualize this calculation.
Consider the following scenario:
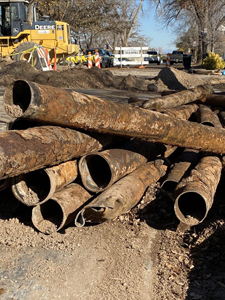
Asset: 1000 feet of 10-inch cast iron pipe; constructed in 1960, installed according to the standard practices at the time
Service History: The pipe is under 70 psi most of the time but has been known to experience pressure surges. The pipe has experienced an increase in pipe breaks over the last 5 years. Five years ago, there was 1 break, four years ago 0 breaks, 3 years ago 1 break, 2 years ago 1 break, and last year 2 breaks. The breaks appear to be from degradation of the pipe.
Service Area: Serves 3 major subdivisions, but there are loop lines available and only residential customers are served. The roadway is not a highway or in any other way difficult to work around. Repair costs are not considered very high for this specific pipe.
Probability of Failure Ranking: 4 – using a PoF scale of 1-5, this asset receives a PoF score of four (4) because the pipe has broken many times over the past 5 years, the break rate is increasing, it experiences pressure variation, and it shows signs of degradation.
Ranking
Description
Consequence of Failure: 2 – using a CoFConsequence of Failure scale of 1-5, the pipe receives a CoFConsequence of Failure of 2 because the service area is residential with no critical customers, there are loop lines so not all customers will be out of water during a repair; repair costs are moderate and the pipe is not in a critical roadway, so repair is relatively easy.
Ranking
Description
Multiply the Probability of Failure with the Consequence of Failure to find the Criticality Score.
Probability of Failure Ranking: 4
Consequence of Failure: 2
To calculate the pipe’s criticality score, multiply the PoFProbability of Failure score by the CoFConsequence of Failure score. In this example, the pipe’s criticality score is 4 x 2 = 8. A table can be helpful to visualize this calculation.

Consider the following scenario:
Asset: A forest surrounding two reservoirs.
Service History: The forest experienced a beetle infestation a couple years ago that left many trees dead. The forest was thinned 15 years ago.
Service Area: The reservoirs are one of the primary sources of drinking water for the city.
Probability of Failure Rating: 4 – using a PoF scale of 1-5, the forest receives a PoF score of four (4) because the forest has not been thinned recently and the dead trees from the beetle infestation increases the likelihood of a significant fire occurring.
Ranking
Description
Consequence of Failure: 5 – using a CoFConsequence of Failure scale of 1-5, the forest receives a CoFConsequence of Failure of five (5) because because if a fire occurred, ash, contaminants and sediment would enter the reservoirs, significantly reducing the water quality. Consequences from such an event could also last weeks or months, possibly even longer depending on the severity of the event.
Ranking
Description
Multiply the Probability of Failure with the Consequence of Failure to find the Criticality Score.
Probability of Failure Ranking: 4
Consequence of Failure: 5
To calculate the forest’s criticality score, multiply the PoFProbability of Failure score by the CoFConsequence of Failure score. In this example, the forest’s criticality score is 4 x 5 = 20. A table can be helpful to visualize this calculation.

Consider the following scenario:
Asset: Bioretention system
Service History: The bioretention system is checked monthly. During this monthly check, trash and weeds are removed and the system is checked for clogging and sediment accumulation. Every other check-in the area is mowed.
Service Area: The bioretention system is checked monthly. During this monthly check, trash and weeds are removed and the system is checked for clogging and sediment accumulation. The sediment load is not usually very large during these checks, except after heavy rains. When heavy rains occur, the silt, trash, and debris can build up and clog the drain. During every second check-in, the area is mowed.
Probability of Failure Rating: 2 – using a PoF scale of 1-5, this asset receives a PoF score of two (2) because the bioretention system receives routine maintenance. However, it is not checked directly after a heavy storm which could cause failures due to erosion and sediment build-up as well as significant trash or debris build-up. Heavy rain is not frequent.
Ranking
Description
Consequence of Failure: 2 – using a CoFConsequence of Failure scale of 1-5, the bioretention system receives a CoFConsequence of Failure score of two (2) because if the bioretention system were to fail, it would negatively impact the aesthetics of the building corridor and potentially cause some minor flooding. However, other bioretention systems in the area could hold and treat the excess stormwater that is bypassing the failed bioretention system or that is flooding out of the system instead of percolating down.
Ranking
Description
Multiply the Probability of Failure with the Consequence of Failure to find the Criticality Score.
Probability of Failure Ranking: 2
Consequence of Failure: 2
To calculate the bioretention system’s criticality score, multiply the PoFProbability of Failure score by the CoFConsequence of Failure score. In this example, the bioretention system’s criticality score is 2 x 2 = 4. A table can be helpful to visualize this calculation.